Forest management by West Coast water utilities: Protecting the source?
by Elizabeth (Betsy) Herbert
The original version of this peer-reviewed article was published in the Journal of the American Water Works Association, February 2007. the article was republished in 2019 by AWWA: In “Sustainable Water Resources: A Compendium of Issues and Trends,” Frederick Bloetscher, Editor.
Below is a shortened version, beginning with maps of Oregon, Washington, and California showing public water utilities in my study:
Location of the 24 public water utilities in Oregon in this study:

Location of the nine public water utilities in Washington in this study:

Location of the twelve public water utilities in California in this study:

INTRODUCTION
This paper summarizes key findings of a research project (Herbert, 2004) that analyzed forest management policies and practices of 45 West Coast public water utilities owning forested land in their source watersheds. The research includes three types of quantitative analysis and six case studies.
Most water utilities nationwide, which depend on surface water, draw water from watersheds over which they have little or no control (Burby, 1983). Therefore, water utility managers view land acquisition as one of the most effective ways to protect water quality (Robbins et al, 1991). Given that land acquisition can be costly, land trusts are increasingly using conservation easements to protect forest land (Barten and Ernst, 2004; Ernst, 2004).
The primary research question driving this study was:
“What is the variation in forest management policies and practices among west coast public water utilities that own forest land, and what factors account for this variation?”
If water utilities seek to buy land or acquire conservation easements in their forested watersheds to protect source water quality, then it is vital to consider how they manage this land once it is purchased. Public water utilities undeniably set an example for other land managers in terms of the importance of source water protection. Conservation easements to protect source watersheds must be designed to protect forests from damaging forest practices, as well as conversion to other land uses.
Emphasis on source water protection for public drinking water supplies has steadily increased since passage of the 1996 Safe Drinking Water Act (SDWA) amendments. Several recent studies have emphasized the value of conserving forest land to preserve source water quality (Barten and Ernst, 2004; Ernst, 2004; Dudley & Stolton, 2003). These studies have made a strong general case for protecting forest land from conversion to other uses, especially development and farming, and have suggested that forestry “best management practices” are useful. However, they have not specifically addressed the potential impacts of forest management practices on water quality.
Earlier studies in source water protection showed that potential impacts from commercial logging and forest road-building are of major concern to water utility managers in some regions. Burby (1983) found that 73 percent of water system managers in rural areas of the Pacific Northwest reported forest activities as a problem source of pollution, compared to only 37 percent of rural water system managers nationwide. Robbins et al (1991) stated that:
“most statewide regulations offer only minimal protection for riparian zones, specify limited public review periods, and do not address cumulative effects on a basinwide level.”
A USDA Forest Service report, aimed at assisting states in assessing potential impacts from human activities to public drinking water supplies, devoted a chapter to forestry (Stednick, 2000). Road construction and other forest practices were identified as potential causes of erosion and stream sedimentation. Other studies from the natural sciences and ecosystem management literature have specifically addressed the ways in which forest operations can affect both ecosystem function and water quality (Dunne et al, 2001; Ice and Stednick, 2004; MacDonald et al, 1991; Reid and Dunne, 1984).
Time-frame. The current study analyzed water utility forest policies and practices from 1986 to 2001. While 15 years is a short period to observe forest management practices, state timber harvest permit documentation was not available prior to 1986. This period was particularly interesting from the source water protection perspective. First, the traditional model of maximum sustained yield was being challenged by a new model of ecosystem management (Cortner & Moote, 1999). Public opinion was shifting dramatically to recognize non-timber values provided by national forests, such as water, recreation and wildlife habitat (Schaberg, 1998; FEMAT, 1993). Second, federal legislative approaches to water quality protection were changing. The focus of the federal Clean Water Act began to shift from point source to nonpoint source pollution, opening the door for addressing watershed-wide pollution from human impacts, such as sediment and nutrients. The 1996 amendments to the SDWA initiated a new emphasis on source water protection, away from total reliance on expensive water treatment solutions. At the same time, local and state environmental groups strengthened their resolve, in response to the weakening of federal laws and enforcement during the 1980s (John, 1994). This period witnessed a marked rise in groups monitoring the health of watersheds (Kenney et al, 2000), with an emphasis on pollution prevention, restoration and protection of ecosystems.
Regulation of water utility forest management. The state Environmental Protection Agency (EPA) offices have generally designated state forestry departments as management authorities for regulation of water quality due to pollution from forest operations. Under state forestry law in this region, public water utilities that practice commercial logging are regulated as private timberland owners. In California, the state and regional water quality control boards have recently begun to re-assert their authority to regulate water quality impacts from timber operations.
SCOPE
This study was limited to public water utilities serving communities that depend primarily on surface water, rather than ground water, from local watersheds within the coast ranges of California, Oregon, and Washington, as shown in Figure 1. All water utilities meeting these criteria were included in the study.

The geographical boundaries of the study were selected to control for climate, terrain, vegetation type, and opportunity for timber extraction. The coast ranges fall within two adjacent coastal terrestrial and freshwater ecoregions, as defined by Ricketts et al (1999). These ecoregions are described as “globally outstanding” in terms of biological distinctiveness, have been severely fragmented and impacted by urbanization and logging, and are described as either endangered or critical (Rickets et al., 1999). The location of commercially valuable forest types within these ecoregions is closely related to terrain and climate. The northern coastal areas have significant stands of Sitka spruce (Picea sitchensis) and western hemlock (Tsuga heterophylla), western red cedar (Thuja plicata) and red alder (Alnus rubra), the region’s principal hardwood (Kimerling and Jackson, 1985). To the east, Douglas fir, western hemlock, western red cedar and Sitka spruce dominate. The redwood region of California is in many ways an extension of the temperate rain forests of western Oregon and Washington, except that it is dominated by coastal redwoods (Sequoia sempervirens) in the foggier areas, and Douglas fir and hardwoods on the drier slopes (Ricketts et al, 2000).
General forest conditions in the study area. Throughout the Pacific Northwest, the amount of old-growth forest has declined by more than 50 percent in the last 60 years, and what remains has become highly fragmented (Spies, 1997). Historically, fire was the dominant natural disturbance, which created a changing mosaic of different aged forests. Presently, despite sporadic catastrophic burns throughout the region, fire has been suppressed, and logging, primarily clearcutting, has become the dominant disturbance. Clearcutting developed as the primary silvicultural system throughout the region because it favored Douglas-fir over more shade-tolerant and less valuable timber species, and because it provided economic and operational advantages (Curtis et al, 1998). Much of the forest land in western Washington and Oregon is occupied by relatively young seral stands that have followed clearing, logging, and wildfire (Franklin and Dyrness, 1988). In 2003, the Oregon Department of Environmental Quality (DEQ) completed its statewide source water assessments of watersheds that supply surface water to public water utilities. For 23 of the 24 Oregon water utilities in this study, the DEQ identified potential contaminating sources due to forestry operations in their source watersheds. In some cases, the water utility owned nearly the entire watershed. (California and Washington had not completed their source water assessments at the time of this writing). In Washington, about 200,000 acres (81,000 ha) are in county and municipal forests, mostly in the western part of the state. This area includes forests managed mainly for revenue from timber yields as well as “some large city watersheds where timber harvesting is limited” (USDA Forest Service, 1997). The Washington Department of Ecology (1999) examined 78 streams in the Yakima River Basin and the Coast Range Ecoregion, finding that poor physical habitat conditions and impaired biological integrity were evident in both regions. Streams in both areas had “excessive sand and fine sediment and deficient large woody debris.” The agency ascribed these conditions to forest land uses, because land use/land cover above streams in both regions was almost entirely forest. In California’s coastal redwood region, only about 4 percent of pre-settlement old-growth forest remains, mostly in state and national parks. Eighty percent of the 5 million acres (2 million ha) of forested land on the North Coast is commercial timber land, with only about 10 percent in protected reserves (FRAP, 1998). Most of the streams in the redwood region have been declared impaired by sediment, and “public conflicts over forest management issues are escalating” (Thornburgh et al, 2000).
The UC Berkeley Forestry Center (Dunne et al, 2001) identified, in the coastal redwood region:
“ . . almost a complete lack of data on water quality, streamflow, terrestrial biota, aquatic populations, the physical condition of streams, components of the water balance, and the degree to which they are altered by timber harvest in the region.”
RESEARCH DESIGN
This study was designed to assess the variation in forest management practices among west coast public water utilities and to identify the factors that account for this variation. The unit of analysis was the community served by the water utility. The author hypothesized that—given similar climate and vegetation types, similar opportunities for commercial timber harvesting, similar dependencies on local surface water—communities with certain enabling factors would produce both stronger forest management policies and better environmental outcomes. To assess the interrelationships between community factors, policies and outcomes, the study employed the “environmental policy capacity” model (Press 2002). Press developed this model to analyze socio-political, economic, and natural land attributes of California counties that were relatively successful in preserving open space.
Community factors. Factors for analysis were selected after Press (2002), and include external influences on the community, such as state and federal mandates and quality of natural resources; internal governmental factors, such as fiscal resources and administrative expertise; and community leadership factors, such as civic engagement and political organization.
Forest management policies. The author reviewed resource management literature, selecting policies for analysis that address forest practices that are widely acknowledged for their potential impact to water quality. Five policy areas were selected:
1. Stream protection zones. Streamside setbacks or buffer zones protect hydrologic and ecosystem function, as well as water quality (Naiman, Bilby, and Bisson, 2000; Abbe and Montgomery, 1996; FEMAT, 1993; Binkley and Brown, 1993; Reid and Hilton, 1998). The federal Northwest Forest Plan (FEMAT, 1993) provided the first science-based approach to riparian protection. These scientists established no-cut/no entry zones of a distance equal to one tree-height on either side of streams, in order to:
". . . protect water quality, maintain appropriate water temperatures, and reduce siltation and other degradation of aquatic habitat that results from timber cutting on adjacent land" (FEMAT, 1993).
While state forestry regulations in all three states now require some streamside buffers, these policies are not as restrictive as FEMAT’s, and tend to provide less protection for the smaller headwaters streams, which if disturbed, are potentially the greatest source of fine sediments (Welsh, Roelofs and Frissell, 2000). The state of Washington requires 50 foot (15 m) no-cut zones around all typed streams in western Washington (Washington Administrative Code 222-30). The Oregon Department of Forestry requires 20-foot (6 m) no-cut zones along major streams (Oregon Administrative Regulations 629-640). In California, the Department of Forestry regulations require setbacks of 75-150 feet (23-46 m) along major streams, but allow some cutting within the setbacks (California Code of Regulations 14 916.5, 936.5, 956.5).
2. Forest road construction. Trombulak and Frissell (2000) summarized the ecological effects of roads on terrestrial and aquatic communities. They warned conservationists not to depend entirely on mitigations and remediation measures to address the multiple ecological consequences of roads, concluding:
“It is critical to retain remaining roadless or near-roadless portions of the landscape in their natural state.”
Luce and Wemple (2001) found:
“The linear nature of roads and their tendency to run across topographic gradients yield an influence on watershed scale hydrologic processes that is much greater than one might expect from the small fraction of the land that they occupy.”
Florsheim et al (2000) cite numerous studies that have documented “the link between roads, increased flow and sediment production related to gullies, road surface erosion and culvert failure in steep and forested areas.”
3. Rotation rate and silvicultural method. Short rotations are the rule in commercial forestry, with stands being clear-cut every 30 to 50 years. Longer rotations are biologically suited to the Pacific Northwest, because Douglas fir and its associates are very long-lived (Curtis, 1997). Clear-cutting results in even-aged stands. In some areas, individual and group tree selection is the standard silvicultural method. With these methods, stands may be entered more frequently. In Santa Cruz County, for example, the same parcel may be logged every 10 years (California Code of Regulations 913.8).
4. Protection of old-growth forest reserves. In addition to providing wildlife habitat, larger, older trees provide hydrological benefits, and reduced soil erosion potential (Curtis, 1997; Harmon et al, 1986).
5. Stream water quality monitoring. The SDWA requires surface water systems to continuously monitor turbidity levels of raw water as it enters the plant. Water treatment specialists highly recommend source water quality monitoring throughout the source of supply (Reinert and Hroncich, 1990). Robbins et al (1991) emphasized that a source water quality monitoring program “is essential to proper management of a surface water supply,” but found that 61 percent of sampled water utilities conducted no water quality monitoring of streams. Without well-designed stream water quality monitoring, it is difficult for water utility managers to track the sources of problems, including their own forest practices.
Environmental outcomes. Choice of indicators of on-the-ground environmental outcomes of a water utility’s forest management policies was limited by availability of data. There were insufficient data to assess source water quality, water treatment costs, and forest road conditions. Four indicators of ecosystem health were selected, based on a review of scientific literature:
1. Old forest reserve ratio. A measure of forest ecosystem function, this is calculated as the ratio of acres of protected old-growth forest/acres owned by the water utility in the source watershed. Marcot (1997) emphasized that maintaining biodiversity of old forests in the west is necessary to preserve ecosystem functions. Press (2002) used actual number of protected acres of old-growth stands as an indicator of positive environmental outcomes.
2. Road density. A measure of hydrologic disturbance, road density is the ratio of miles (kilometers) of forest roads to acres (ha) owned in the watershed. GIS tools were used to calculate miles of forest roads from state timber harvest plan and water utility maps. The National Marine Fisheries Service (NMFS, 1996) used road density as an indicator of watershed condition in formulating guidelines for salmon restoration on the Pacific coast. NMFS designated road densities greater than 3 miles per square mile (1.9 km/ sq. km) of watershed as an indication that the watershed is “not properly functioning.”
3. Predominant forest stand age. A measure of forest ecosystem function, predominant forest stand age serves as an indicator of species diversity, with older forests generally demonstrating more biodiversity than younger ones (Marcot, 1997). Mature forests provide three ecosystem functions of direct relevant to water utility watersheds. First, older forests have a higher capacity for intercepting fog and rain (FEMAT, 1993). Second, they maintain a low soil erosion potential. Third, they enhance channel stability by producing woody debris with longer retention times, due to their size and resistance to decay (Harmon et al, 1986). Predominant forest stand age was estimated for each case study watershed in 2001, by consulting water utility forest management plans, forestry permits, and sanitary surveys, through interviews with water utility foresters, and by direct observation during watershed tours.
4. Logging intensity. Logging intensity is a good indicator of the level of chronic land disturbance (Curtis, 1997). In this study, logging intensity was based on watershed acreages logged over time.
Generally speaking, the larger the proportion of the land surface that is disturbed at any time, and the larger the proportion of the land that is sensitive to severe disturbance, the larger is the downstream impact (Dunne et al, 2001).
The undisturbed forest with its understory, leaf litter and organically enriched soil is the best watershed land for minimizing erosion by water (Dudley & Stolton, 2003).
METHODS
To select water utilities for inclusion in this study, a questionnaire was mailed in the spring 2001 to 230 public water utilities within the coast ranges of the region that use surface water. The contact list, obtained from state department of health offices, was pre-screened to select only water utilities that use surface water, and that serve communities of at least 200 people. The multiple-choice questions were designed to ascertain if the water utility owned forest land, approximately how much land it owned, the land uses it managed for, and the other landowner categories in its source watersheds. After follow-up phone calls and repeated mailings, forty-five water utilities were identified for the study.
Four types of analyses were conducted:
• A descriptive analysis of all the water utilities in the study
• A quantitative analysis to test the relationship between logging intensity and other variables
• A quantitative community factors analysis
• A cross-case comparison of six in-depth case studies.
For the descriptive analysis, study questionnaire responses and public information were used to determine acreage owned, watershed size, and population served for each of the 45 water utilities. The author used spreadsheets to organize data, to calculate percentage of watershed owned, and to graph data.
A quantitative analysis was used to test the relationship between water utility logging intensity and other variables. Logging intensity (L) was calculated for each of the 45 water utilities from state forestry permit data. L was calculated as the average annual percent of the utility-owned acreage that was commercially logged, from 1986-2001. Correlation coefficients were calculated to test the relationship between L and percent of watershed owned, acreage owned, and population served.
For the quantitative community factors analysis, questionnaire response data were tabulated and analyzed to identify community factors strongly associated with a water utility’s policy to either practice or not practice commercial logging. A statistical analysis was used to construct a profile of water utilities that practice commercial logging vs. those that don’t.
Six case studies were selected by identifying the most similar cases with different outcomes, after Goodin and Klingemann (1996). A pair of cases from each state was selected so that they were most similar in terms of percent of watershed owned, acreage owned, population served, and economic resources, but most different in terms of logging intensity (L). Cases were assessed in terms of community factors, forest management policies, and indicators of ecosystem health. To assess community factors, more than 40 interviews were conducted with key actors including elected officials, water utility staff, and community leaders. To analyze forest management policies, the author consulted forest/watershed management plans, timber permits, and foresters. If a water utility had no written policy, and it practiced commercial forestry, the state regulatory policy was used. To assess selected ecosystem health indicators, the author reviewed source water assessments, state forestry permits, water utility records and maps. The author, accompanied by water utility staff, toured and photographed each watershed. Each source watershed was mapped overlaying USGS aerial photographs. GIS technology was used to show acreage of timber harvests, roads, streams, and potential contaminant sources. Case studies were compared by community factors, policies, and outcomes.
RESULTS
Figures 2-5 describe the 45 water utilities in terms of watershed acreage owned, percent of watershed owned, neighboring landowner types, and water utility land uses. Figure 2 shows the distribution of acreage owned by water utilities, ranging from 7.5 to 22,000 acres (3.0 to 8900 ha). Nineteen of the 45 water utilities own 200 acres (81 ha) or less of the watersheds that supply their surface water, while 18 own more than 1,000 acres (400 ha). Figure 3 shows that 15 of the 45 water utilities own less than five percent of their source watersheds, while 9 of the 45 own more than 75 percent. Figure 4 shows that in Oregon and Washington, the most frequently reported category of neighboring landowner was private commercial timberland, followed closely by private residential. In California, the most frequently reported category was private residential, followed by a rather even mix of other land owner types. With regards to how water utilities manage their own lands, Figure 5 shows that in Oregon and Washington, the most frequently reported use on utility-owned land was timber harvest, while in California, the most frequently reported use was recreation.
Figure 2: Percentage of source watershed owned by water utilities, by state

Figure 3: Types of uses*on utility-owned land, by state

*As reported by 45 water utilities in this study; multiple landowner types often reported
Figure 4: Types of uses* on utility-owned land, by state

*As reported by 45 water utilities in this study: multiple land uses often reported
Figure 5: Average annual percent of utility-owned acreage logged by 45 water utilities

Variation in logging intensity. Figure 6 shows the variation in logging intensity among the 45 public water utilities. Average annual acres (ha) commercially logged ranged from zero percent to 8.3 percent, with a mean of 1.6 percent, and a standard deviation of 2.1 percent. Figure 7 shows logging intensity, by state. Six out of the 12 water utilities in California had done no commercial logging from 1986-2001, compared to 5 out of 24 in Oregon, and 3 out of 9 in Washington. Four water utilities in Oregon and one in California had logging intensities averaging more than five percent per year during this period. (If a watershed were clearcut at the rate of 5 percent per year, in 20 years the entire watershed would be cut, leaving no tree older than 20 years). No significant correlation was found between percent of watershed owned, acreage owned, or population served with logging intensity (L). The correlation coefficients had magnitudes less than 0.25.
Figure 6: Average annual percent of utility-owned acreage logged by water utilities, by state

Acreage logged
Source: State forestry department timber operation permits
Community factors. Statistical analysis of the study’s mail questionnaire responses identified community factors (C) that are strongly associated with a water utility’s policy to either practice or not practice commercial logging (L). Table 1 shows that among water utilities that report practicing commercial logging, more than three times as many prohibit recreation in their watersheds than allow it. More than six times as many have commercial timberland owners as neighbors than those that don’t. Nine times as many are governed by city councils than by special district boards.
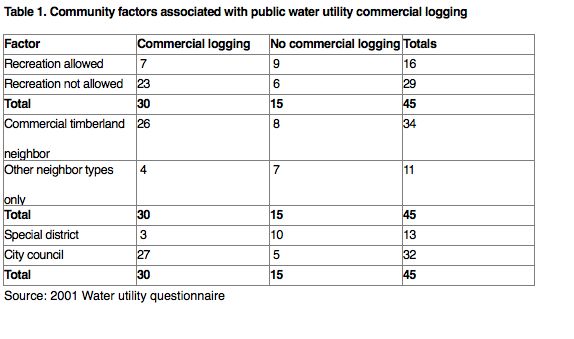
Among water utilities that haven’t practiced commercial logging, type of governance is the most important distinguishing factor. Twice as many water utilities in this category were governed by special districts than were governed by city councils.
Data from Table 1 were used to compute a score for community factors (C). In particular:
if the water utility allows recreational use of their land X = 0; otherwise X = 1;
if the water utility is managed by a special district Y = 0;
otherwise, if managed by a city council Y = 1;
if the water utility has no commercial timberland neighbors Z = 0; otherwise Z = 1.
Using these values, C = X + Y + Z was calculated for each water utility. C has four possible values {0, 1, 2, 3} as shown in Table 2.
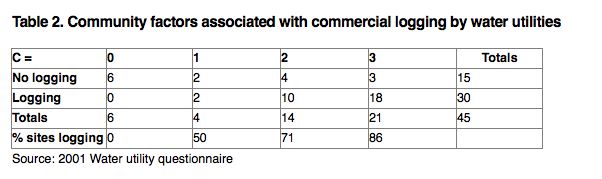
Similarly, a discrete value was assigned to L, based on the water utility’s reported use or non-use of commercial timber harvest as a land use. Table 2, for example, shows that a total of six water utilities had a C value of zero, meaning that they allowed public recreation, that they were special districts, and that they had no commercial timberland neighbors. Of those six, none practiced commercial logging. At the other end of the scale, a total of 21 water utilities had a C value of 3, meaning that they did not allow public recreation, that they were part of city government, and that they had commercial timberland neighbors. Of those 21 water utilities, 18 (86 percent) practiced commercial logging. A chi-square analysis of these data found a strong relationship between these community factors (C) and the water utility’s policy regarding commercial logging (L). The resulting χ statistic of 16.1, corresponding to a p-value of 0.001, allows rejection of the null hypothesis that logging activity (L) is randomly distributed with respect to these community factors (C). These results also indicated a need for further investigation to understand how these community factors, and perhaps others not analyzed by this test, influence water utility policy-making.
CASE STUDY SUMMARIES AND COMPARISONS
The following narratives compare each pair of case studies and describe key community factors, which influenced the water utility’s forest management policies and environmental outcomes.
California case studies: Brooktrails Township and city of Willits. While the city of Willits logged its 2,927 acre (1185 ha) forested watershed holdings intensively from 1986-2001, its next door neighbor Brooktrails Township, did virtually no commercial logging on its 2,000 acre (810 ha) watershed lands. Both places inherited problems caused by mismanagement of previous landowners, and both places have struggled to find politically acceptable revenue sources for their water systems and watersheds, within a transitional rural, timber-based economy. The key differences leading to different management paths included visibility and public access to the watershed, type of governance, and effectiveness of local environmental groups.
When the city of Willits bought its watershed lands in 1984, previous landowner Pacific Gas & Electric (PG&E) had logged the most valuable old timber from the watershed, but had left some lower quality harvestable timber (sometimes referred to as “high grading”). The state Public Utilities Commission (PUC) required by law that timber revenues be re-invested in the water system. However, the PUC found, shortly after the city acquired the watershed, that $1.4 million of the timber harvest revenues realized by PG&E were never re-invested in the water system. As a result, when the city bought the property, it received a failing water treatment plant, a reservoir that was filling with silt, and a host of water quality problems. The state Department of Water Resources (DWR) conducted a study of the Willits watershed that found past logging had contributed to the existing water quality problems, and recommended a reduction in watershed disturbance. One month after purchasing the system, the city learned it would need a new water treatment plant and a new reservoir, and began looking for ways to fund them. Recognizing the political liability of big rate hikes, the city council sought and received federal and state loans. To repay these loans, the city turned to its watershed timber revenues. The city contracted a local forester to write a forest management plan, which focused on maximum sustained yield of timber, and despite protests by several citizens, approved the plan and proceeded with commercial logging. The opportunity to adopt a model of source water protection had passed. Water quality protection would rely on expensive water treatment technology, to be financed by resource extraction from the watershed. Source water quality problems documented by the DWR would continue, and high turbidities would routinely place high demands on the water treatment system.
Brooktrails Township was built in 1968 on the site of an old sawmill. The lands had been heavily cut-over and criss-crossed with logging roads. The Brooktrails development plan focused on preserving redwood trees and open space, but a forest/watershed management plan was never implemented. The township’s elected board proposed plans, but they advocated commercial logging to finance watershed restoration. The majority of Brooktrails residents were opposed to commercial logging, and these plans failed to be adopted. Residents feared that, once commercial logging was allowed, timber revenues would drive the rate of cut. In the absence of a watershed management plan, forests were allowed to mature, but serious issues were left unaddressed, especially with regards to roads. The township’s paved road system, officially managed by the county, had failing culverts, and miles of old, unmaintained logging roads continued to erode. Figure 8 shows a typical old logging road. The severity of this problem was not recognized until 2003, when the state Department of Health Services (DHS) found that the township’s main reservoir had filled with so much silt that it had insufficient capacity to serve existing water customers. DHS ordered the district not to allow any new water connections. Brooktrails residents must now decide how they will pay for fixing these failing roads. In 2005, the board proposed another forest management plan, which again recommends using timber revenues for this purpose.
Both the Willits and Brooktrails watersheds have compelling vistas and valuable native wildlife habitats. However, the Willits watershed lies four miles (6.4 km) outside of town and is closed to the public, while the Brooktrails watershed is immediately visible and open to its residents for passive recreational use.
In Willits, the only authorized watershed use is resource extraction. The main roads in the watershed are routinely used by gravel trucks hauling from the city’s gravel pit mine, and periodically used by logging trucks. One local informant stated that the community’s physical disconnection from its watershed was the reason that most people in Willits haven’t objected to the logging and mining:
“They aren’t allowed to hike in it, so nobody has a stake in it other than they drink the water. As long as they turn on the tap and it comes out, everybody is happy. . . It’s funny, one thing about the Willits watershed that I have noticed, is that it’s always been this off-limits thing. People can’t go there. . .”
Brooktrails township, on the other hand, was designed to be integrated into its common forested greenbelt, with most of its developed areas below its source watershed. Access and visibility gave residents a stake in preserving recreation and aesthetic values. Still, degraded road conditions remained unaddressed.
The city of Willits provides water to 7,500 water users, thirty-two percent of whom live outside the city limits. Since only city residents are entitled to vote in city council elections, almost one third of Willits water users have no voice in how their water system or watershed is managed. On the other hand, local businesses have clout because they are the sole providers of sales tax, the lifeblood of the city’s general fund. Commercial businesses, including local sawmills, have maintained a strong representation on the city council. The council has remained committed to using timber revenues to finance their water system, and they have resisted forming a citizen advisory committee to address forest/watershed management issues. In Willits, the only group active in local environmental issues voiced concerns about watershed management to the city council, but the city council dismissed these concerns.
Brooktrails Township is a special district whose central function is to provide water to its 3,385 residents; it has no business customers and collects no sales tax. Its board of directors is elected by registered voters who reside or own property in the township. Thus, all water users in Brooktrails, unlike Willits, have a voice in determining how their watershed is managed. The Brooktrails Board has routinely appointed residents to serve on voluntary advisory committees, and has actively recruited citizens through newsletters and its website. Residents organized a hiking club, which voluntarily maintains the greenbelt trails.
Oregon case studies: McMinnville and Forest Grove. Forest Grove and McMinnville are neighboring cities in northwestern Oregon, where the timber industry has declined but is still part of the regional economy. While both cities own thousands of acres of forestland in their watersheds, they manage them very differently. McMinnville Water & Light (W&L) has continued a program of maximum sustained yield of timber for half a century. From 1990-2001, W&L clear-cut 1,002 acres (400 ha) and partially cut 1,827 acres (740 ha) of its watershed lands, roughly 45 percent of its 6,572 acre (2660 ha) ownership. Its timber revenues have completely financed its complex water treatment and storage system. Figure 9 shows a W&L clear-cut. Forest Grove also practiced intensive logging in its watershed, but stopped in 1989, after a controversial clear cut outraged its citizenry. Forest Grove’s city council placed a moratorium on logging that was finally lifted in 2001, after it appointed a citizen advisory group to create a forest plan, based on the ecosystem management paradigm. The community factors that most distinguish Forest Grove from McMinnville are type of governance, public watershed access, and the effectiveness of local environmental groups.
The Forest Grove water department is governed by a city council. The director of public works administers the city’s watershed lands and supervises a consulting forester. The city council has appointed two citizen advisory committees that were involved in the watershed planning process. The Committee for Citizen Involvement conducts the city council’s annual town meeting, and published a 1997 handbook to enable citizen involvement in land use planning. The Watershed Ad Hoc Committee was appointed by the Forest Grove City Council in 2000 to assist its consulting forester in creating a new watershed management plan. The committee represented a cross-section of the community, including large commercial water users, a local university professor, environmental activists, and private timberland owners. The committee worked with the local branch of a statewide non-profit to recruit volunteers to remove non-native, invasive species in the city’s watershed.
W&L’s water system is the most insulated from civic participation of all the case studies. While the city of McMinnville has a typical mayor/city council form of government, W&L is directed by a unique five-member commission. The mayor serves as the commission’s ex-officio chair, and he appoints the other four members. The commission makes all policy decisions that affect watershed management, and is heavily weighted toward commercial business interests and large water users. The commission convenes monthly at open meetings. W&L’s contracts with a consulting forester to manage the watershed. It continues to use its 1979 forest management plan, which is based on a model of maximum sustained yield of timber. In 1987, the mayor appointed a “Blue Ribbon” watershed committee, composed only of foresters and an attorney who represented forest landowners, to review W&L’s dependence on outside forestry consultants to advise the W&L Commission about forest management. The committee’s report ensured that public participation would be kept out of the process:
“It is our opinion that the independent nature of the consultants gives a certain ‘freedom’ from politics that allows the management recommendations being made to be based on resource needs only.”
Forest Grove’s two major funding sources for its water system are water rates and system development charges (SDCs). Until 1989, Forest Grove subsidized both water user fees and SDCs with timber revenues, in order to charge their customers lower water rates. After the logging moratorium in 1989, these low rates continued, and the city’s water fund began to run a deficit. A 2000 city study showed that existing rates clearly favored large water users, and provided no incentive to conserve water. Recognizing the problem, the city began raising water rates annually and changed their rate structure to provide conservation incentives. The 2001 Forest Grove watershed management plan estimated that 750,000 board feet of timber could be cut every year without damaging the ecosystem, providing estimated net revenues of $200,000-$250,000. The plan specified that, “Harvest levels shall be based on forest health and other ecological goals, and shall not be revenue driven.” This management philosophy is consistent with that applied to many eastern watershed forests (Barten et al., 1998).
W&L has had a longstanding policy of using timber revenues to subsidize water user fees and SDCs, enabling them to charge some of the lowest rates in the state. According to a recent W&L survey, the cost of their annual water utility operations exceeded customer rate charges by $1.3 million, with watershed timber revenues making up the difference. For many years, W&L gave volume discounts, which benefited their largest water users. Recently, at the request of W&L’s accounts manager, W&L has begun to bring water rates in line with operating costs. He pointed out that if their timber resource were to be lost in a forest fire, their main source of revenue would no longer exist, and banks would probably not lend them money. The utility has moved incrementally to create incentives for water conservation.
W&L’s timber revenues continue to subsidize SDCs, which are are used to finance water system capital expenditures. One of the stated goals of their forest management plan is for timber in the watershed to provide “a source of revenue to defray existing and future capital expenditures.”
W&L has designed its water system to allow them to periodically drain the reservoir to repair the dam and remove silt and debris that wash down from the watershed. W&L’s water treatment plant was upgraded in 1997, at a cost of about $1 million. But they will soon need to build a new water treatment plant, at a cost of $7–9 million, according to W&L’s manager.
During the moratorium on city watershed logging from 1989-2001, Forest Grove’s official policy was to keep the watershed closed to the public, except by special permission. In 1998, a political science professor at the local university received permission to take his students there to observe salmonid habitat. Following their hike, they gave the city council a list of recommendations to improve salmon habitat, which included limiting logging on steep slopes and along streams, and fixing failing roads and culverts. They recommended that the city council focus on public education, so that citizens could understand “that water consumption, capital expenditures for water treatment, and timber harvest in the watershed are closely connected.” They requested that the council “establish a Watershed Commission composed of a broad cross-section of citizens to advise the Council and review plans” . . . and to “ensure timely and regular attention to the watershed.” This student tour eventually led Forest Grove to form the Watershed Ad Hoc Committee, which oversaw the drafting of the city’s 2001 watershed management plan. The plan acknowledges the important role of citizen connection to the city’s watershed:
“An important social benefit (though intangible) is the ‘sense of place’ and connection to the surrounding resource lands that a watershed can foster in a small community. This is evidenced by the concern over past management practices and the current public interest in forest health and fisheries management issues in the watershed . . .”
The city continues to prohibit general public access, except for tours and volunteer restoration work.
The W&L watershed, on the other hand, has remained virtually off-limits to the public, since the 1979 W&L forest management plan prohibited public access, ostensibly to protect water quality. In Forest Grove, citizen groups have used the forest management issue to win seats on their city council and to participate in the process of creating a watershed management plan to their liking. Citizens concerned about logging in the city’s watershed helped initiate a grass roots movement to generally improve citizen involvement in government. In McMinnville, several local informants noted that there wasn’t much environmental organization in the city. Attempts by statewide NGOs to organize local groups tend to “fall apart after a year,” according to one informant.
Washington case studies: Hoquiam and Ilwaco. Once the center of the timber economy during its 1920s heyday, the cities of Hoquiam and Ilwaco on the coast of Washington have struggled with economic hard-times for years. State records showed that Hoquiam logged an annual average of 0.8 percent of its 5,360 acres (2170 ha) of watershed lands from 1986-2001, while Ilwaco conducted virtually no logging of its 935 acre (378 ha) watershed. Research revealed that Ilwaco had not done any logging simply because there was no timber left to cut. The city bought the land in 1986, just after it had been clear-cut by timber companies. Hoquiam, on the other hand, acquired the bulk of its watershed land in the 1930s, and the forest still had significant stands of older western hemlock.
The Ilwaco case illustrates problems confronting cities that have purchased cut-over forestland to manage as a public water source. When Ilwaco’s previous water supply in town, Black Lake, became too polluted to treat in the 1970s, the city needed to find another water source. In the late 1980s, it purchased the recently clear-cut Indian Creek watershed from timber companies, and built a reservoir and water treatment plant there. Old, unmaintained logging roads are still an apparent problem. The city must now treat water from this degraded watershed to federal and state standards. The forest stands in Ilwaco’s watershed are now about 15 years old. Forest management may become an issue when the forest is old enough to cut again, but it has not been on the city council agenda in recent years. Ilwaco’s 1997 watershed control plan recommended that the city continue using “good forestry practices that meet current federal, state, and city standards.” The plan apparently was recommending a continuation of the extensive clear-cutting and road-building conducted by the previous landowners. The plan failed to mention the failing forest road system, or address the potential impacts of this degraded watershed to water quality. At the same time it reported that:
The raw water from Indian Creek contains variable amounts of turbidity, high iron, high manganese, and variable amounts of other organic compounds which complicate water treatment.
While Ilwaco’s forest is young and even-aged, Hoquiam’s forest has many different age classes. According to Hoquiam’s 1994 watershed management plan, the city’s Davis Creek watershed property had 1,400 acres (570 ha) of 80-90 year old forest, and its Little Hoquiam watershed property had nearly 600 acres (240 ha) of forest stands exceeding 90 years in age. In these older stands, increased vegetation along forest roads was associated with lower sediment levels in road ditches. Hoquiam’s management plan recommends reducing road density in its upper watersheds.
Both Ilwaco and Hoquiam have source watersheds that are located several miles outside of town. Ilwaco’s watershed is completely closed to the public. Hoquiam’s watershed is partly visible from the highway, where some of its older forests contrast sharply with the expansive clear-cuts on nearby private land. While Hoquiam’s policy generally prohibits public access, the city has made two exceptions that are compatible with the forest management plan’s recommendation to increase public education and access. First, the city allows ornamental greenery picking by local residents. Second, it buses local sixth graders to the watershed to plant trees. Though the city’s watershed management plan recommends keeping vehicular traffic to a minimum, Hoquiam allows an annual Pro-Rally stock car road race in the city’s highest quality watershed, Davis Creek. While the race has proven controversial, the city council insists that it is harmless to the watershed, though no analysis has been done, and that it helps the city by attracting tourists.
Ilwaco has been much more successful in obtaining state and federal grant money than Hoquiam. Ilwaco has no harvestable timber, and hence, no timber revenue. It has financed its water operations and capital expenditures through water user rates, SDCs, and state and federal funding. Ilwaco’s mayor credited the promise of a new housing development, which is expected to double the town’s population, with much of the city’s funding success. He expects this new development to bring in more tax revenue, and more SDCs to the city. At the same time, it will challenge the city’s infrastructure and water supply capacity.
Unlike Ilwaco, Hoquiam depends largely on timber revenues from its source watersheds to subsidize water and sewage treatment operating costs, as well as infrastructure costs. Annual water and sewer revenues fall consistently below the city’s total expenditures for these utilities. Hoquiam’s dependence on timber subsidies has created an incentive to over-cut the watershed, even though its watershed plan, adopted by the Hoquiam city council in 1994, drafted policies aimed at preventing that. Recognizing the potential conflicts between exploitive logging and water quality, the management plan recommended continuing the 100 year rotation rate, in effect since the city acquired the watershed. A shorter rotation would result in an increased rate of cut that would likely increase sediment yield. The plan advised limiting timber harvests by acreage rather than volume. A volume-driven rate of cut might result in cutting too much acreage, in order to make up for low volume, and hence adversely affect water runoff. The plan recommended limiting clear-cuts to 20-30 acres (8 to 12 ha), not to exceed 55 acres (22 ha) per year. The Hoquiam city council has failed to follow those recommendations. Figure 10 shows a clearcut on Hoquiam’s ownership. There are two other incentives to increase the rate of cut. First, Hoquiam has used timber revenues both to guarantee bonds, and to get matching grants from government agencies. It received a state Clean Water Act grant to assist in silt removal from its reservoir, and another state grant to complete a watershed restoration project to reduce sedimentation caused by forest practices and road-building. (Hoquiam owns only about half of its source watershed land. Timber companies own the other half, so their logging operations also contribute to the cumulative effects.) The second incentive is the city council’s perception that the Endangered Species Act will eventually prevent them from harvesting their mature forest stands, in order to protect spotted owl and marbled murrelet habitat. Most city council members expressed the need to cut these stands while they can. They recently hired a logger who shares this view, rather than a professional forester, to manage their forests.
CASE STUDY DISCUSSION
Tables 3, 4, and 5 summarize the results of the case study analysis in terms of community factors, forest management policies and ecosystem health indicators. Table 3 shows that the community factors that most distinguished one case from another were public visibility of, and access to, the watershed, number of local environmental groups, and age of forest stands at time of acquisition.

The Forest Grove case demonstrated that even limited public access to a watershed, located miles outside of town, can spark civic enthusiasm for better forest management policies, especially if strong local environmental organization already exists. Cases with more citizen involvement had larger no-cut zones around streams, and protected existing old forests (Tables 4 and 5).
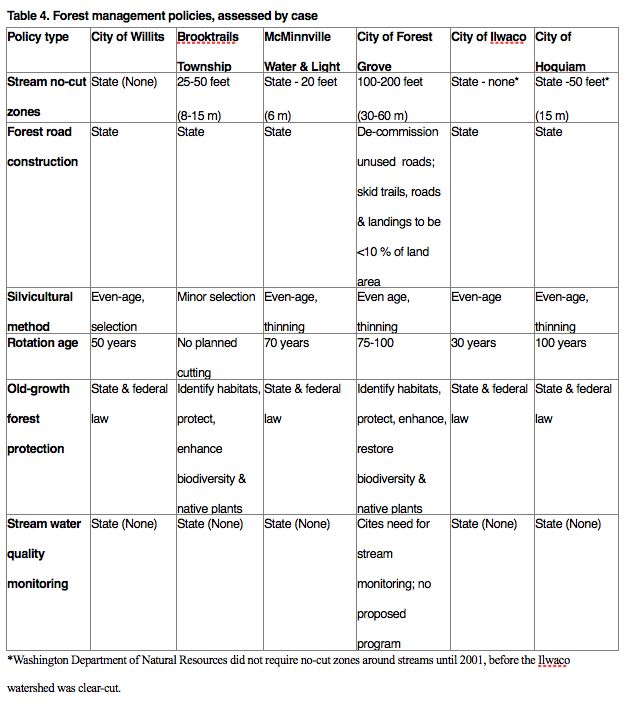

In cases where the watershed is completely off-limits to the public, water utilities did not exceed state standards in terms of streamside buffer zones (Table 4), forests were logged more intensively, forests were younger, and there were no protected old forest reserves (Table 5). In all cases except Hoquiam, forest road densities exceeded the maximum specified for watershed health by the National Marine Fisheries Service (1996). No case had a source water quality monitoring program in effect within its source watershed.
CONCLUSIONS AND RECOMMENDATIONS
While water utilities consider acquisition of watershed lands to be one of the most effective ways to protect water quality, this study shows that source water protection is not necessarily the sole motivation for acquiring and managing forested land. A conflicting motivation is access to timber revenues. There is a fundamental difference between maximum sustained yield of timber and forest management for water quality protection. Public water utilities that practice exploitive logging in their source watersheds increase watershed disturbance and risk impacting forest ecosystem functions that provide high quality source water. Relying on timber subsidies from its own watershed lands— instead of charging realistic water rates—further disengages a water utility from its customers, its most dependable source of income.
Public access allows public scrutiny of forest/watershed management practices. However, water utilities that most heavily log their watersheds frequently keep them closed to the public, ostensibly to protect water quality. Still, an involved citizenry can turn exploitive forest management practices into those that protect water quality and sustain the ecosystem, while still allowing limited timber production.
Public participation in watershed planning is critical to the success of any source water protection program. City governments, which are more responsive to business concerns, tend to be more insulated from public participation than special districts, which are more responsive to residential concerns.
Two recommended policy changes would create incentives for more effective source water protection, and less reliance on timber subsidies. First, timber revenues should not be allowed as guarantees for EPA loans for capital improvements and watershed restoration. Second, when land trusts purchase conservation easements to protect source water quality, these easements should require forest management practices that protect ecosystem functions, such as reducing road densities, and establishing old forest reserves and significant riparian no-cut zones.
REFERENCES CITED
Abbe, T. B.; & Montgomery, D. R. 1996. Large woody debris jams, channel hydraulics, and habitat formation in large rivers. Regulated River Research & Management 12:201-221.
Barten, P. K. & Ernst, Caryn E. 2004. Land Conservation and Watershed Management for Source Protection. Jour. AWWA. 96:4, 121-135.
Barten, P. K.; Kyker-Snowman, T.; Lyons, P.J.; Mahlstedt, T.; O’Connor, R. and Spencer, B.A. 1998. Massachusetts: Managing a Watershed. Journal of Forestry. 96(8):10–15.
Binkley, D. & Brown, T. C. 1993. Forest practices as nonpoint sources of pollution in North-America. Water Resources Bulletin 29(5):729-740.
Burby, R. J. 1983. Drinking Water Supplies: Protection through Watershed Management. Ann Arbor Science Publishers, Ann Arbor, Michigan.
Cortner, H.J. & Moote, M.A. 1999. The Politics of Ecosystem Management. Island Press, Wash., D. C.
Curtis, R. O. 1997. The Role of Extended Rotations. In Kohm, K.A. & Franklin, J.F., eds. Creating a Forestry for the 21st Century: The Science of Ecosystem Management. Island Press, Wash., D. C.
Curtis, R.O., DeBell, D.S.; Harrington, A.;Lavender, D.P; St. Clair, J.B, Tappeiner, J.C.; Walstad, J.D. 1998. Silviculture for multiple objectives in the Douglas-fir region. USDA Forest Service. Pacific Northwest Research Station. PNW-GTR-435.
Dudley, N. & Stolton, S. 2003. Running Pure: The Importance of Forest Protected Areas to Drinking Water. World Bank/World Wildlife Fund Alliance for Forest Conservation and Sustainable Use.
Dunne, T. et al. 2001. A Scientific Basis for the Prediction of Cumulative Watershed Effects. Wildland Resources Center. University of California, Berkeley.
Ernst, C. E. 2004. Protecting the Source. The Trust for Public Land & the AWWA.
FEMAT. 1993. Forest Ecosystem Management: An Ecological, Economic, and Social Assessment. Report of the Forest Ecosystem Management Assessment Team. GPO Pub. 1996-793-01, Wash., D. C.
Florsheim, J. L.; Mount, J. F.; and Rutten, L. T. 2000. Effect of baselevel change on floodplain and fan sediment storage and ephemeral tributary channel morphology, Navarro River, California. Earth Surface Processes and Landforms 26: 219-232.
Franklin, J.F. & Dyrness, C. T. 1988. Natural Vegetation of Oregon and Washington. Oregon State University Press.
FRAP (Resources Assessment Program). 1998. The Land Base of California’s Forests. California Department of Forestry & Fire Protection. Sacramento.
Goodin, Robert E. and Hans-Dieter Klingemann, eds. 1996. A New Handbook of Political Science. Oxford University Press.
Harmon, M.E., J. F. Franklin, F. J. Swanson, P. Sollins, S.V. Gregory, J. D. Lattin. 1986. Ecology of coarse woody debris in temperate ecosystems. Advances in Ecological Research 15: 133-302.
Herbert, E. 2004. Forest management by West Coast water utilities: Influences and consequences. Ph.D. dissertation. University of California, Santa Cruz.
Ice, G. G. & Stednick, J.D. (eds.). 2004. A century of forest and wildland watershed lessons. Society of American Foresters, Bethesda, Maryland.
John, D. 1994. Civic Environmentalism: Alternatives to Regulation in States and Communities. QC Press, Wash., D.C.
Kenney, D. S., et al, 2000. The New Watershed Source Book: A Directory and Review of Watershed Initiatives in the Western United States. University of Colorado School of Law, Denver
Luce, C.H and Wemple, B. C. 2001. “Introduction to special issue on hydrologic and geormorphic effects of forest roads.” Earth Surface Processes and Landforms 26: 111-113.
MacDonald, L.H., Smart, A.W. & Wissmar, R. C. 1991. Monitoring Guidelines to Evaluate Effects of Forestry Activities on Streams in the Pacific Northwest and Alaska. Center for Streamside Studies. US EPA, Seattle.
Naiman, R.J.; Bilby, R.E. & Bisson, P.A. 2000. Riparian ecology and management in the Pacific Coastal Rain Forest. BioScience. 50(11): 996-1011.
Press, D. 2002. Saving Open Space. The Politics of Local Preservation in California. UC Press, Berkeley.
Reid, L. M.; Dunne, T. 1984. Sediment production from forest road surfaces. Water Resources Research 20(11): 1753-1761.
Reid, L.M. & Hilton, S. 1998. Buffering the Buffer. USDA Forest Service. Gen Tech. Rep. PSW-GTR-168.
Reinert, R.H. & Hroncich, J.A. 1990. Source Water Quality Management. In Pontius, F.W. (ed)., Water Quality and Treatment, a Handbook of Community Water Supplies. AWWA, McGraw-Hill, New York.
Marcot, B.G. 1997. Biodiversity of Old Forests of the West: A Lesson from Our Elders. In Kohm, K.A. & Franklin, J.F., eds. Creating a Forestry for the 21st Century, the Science of Ecosystem Management. Island Press. Wash., D.C.
National Marine Fisheries Service (NMFS). 1996. Coastal Salmon Conservation: Working Guidance for Comprehensive Salmon Restoration Initiatives on the Pacific Coast. National Oceanic & Atmospheric Administration, U.S. Department of Commerce.
Ricketts, T. et al, 1999. Terrestrial Ecoregions of North America: A Conservation Assessment. Island Press, Wash., D.C.
Robbins, R.W., Glicker, J.L., Bloem, D.M., & Niss, B.M. 1991. Effective watershed management for surface water supplies. Jour AWWA. December.
Schaberg, R.H. 1998. Integrating economic trade-offs with ecological possibilities: Citizen preferences for ecological goods and services from two southeastern national forests. Ph.D. dissertation. North Carolina State University.
Spies, T. 1997. Forest Stand Structure, Composition and Function. In Kohm, K.A. & Franklin, J.F., eds. Creating a Forestry for the 21st Century, the Science of Ecosystem Management. Island Press. Wash., D.C.
Stednick, J.D. 2000. Timber Management. In Dissmeyer, G.E., ed. Drinking Water from Forests and Grasslands, A Synthesis of the Scientific Literature. USDA Forest Service. Southern Res. Sta., Gen Tech Report SRS-39.
Thornburgh, D.A. et al, 2000. Managing Redwoods. In Noss, R.F., ed. The Redwood Forest—History, Ecology, and Conservation of the Coast Redwoods. Island Press, Wash., D.C.
Trombulak, S.C. & Frissell, C. 2000. Review of ecological effects of roads on terrestrial and aquatic communities. Conservation Biology 14 (1):18-30
USDA Forest Service. 1997. Washington’s Public and Private Forests. Pacific Northwest Research Station. PNW-RB-218.
Washington Department of Ecology. 1999. Biological Assessment of Small Streams in the Coast Range Ecoregion and the Yakima River Basin. Publication No. 99-302.
Welsh, Jr., H.H.; Roelofs, T.D.; Frissell, C.A. 2000. In Noss, R. F. (ed.). The Redwood Forest: History, Ecology, and Conservation of the Coast Redwoods. Chapter 6: “Aquatic Ecosystems of the Redwood Region,” pp. 165-199. Save-the-Redwoods League. Island Press, Covelo.